
How to Predict Customer Satisfaction (CSAT) at the Household Level: A Guide for Utilities

In the evolving utility sector, delivering exceptional customer satisfaction (CSAT) remains a complex challenge. Utilities are frequently confronted with issues such as service interruptions, billing conflicts, and inconsistent support. Service disruptions, whether due to maintenance or outages, can lead to frustration and dissatisfaction. Billing conflicts, including errors or unclear charges, often result in confusion and grievances. Additionally, inconsistent support – such as long response times or unresolved issues despite repeated contact – can leave customers feeling undervalued and ignored.
The Importance of Predicting CSAT at the Household Level
Predicting CSAT at the household level is crucial for utilities to manage customer satisfaction proactively. By forecasting potential issues and understanding the factors that influence satisfaction, utilities can address concerns before they escalate. This proactive approach shifts utilities from reacting to problems to preventing them, enabling timely resolutions and tailored strategies. Effective prediction helps in crafting personalized engagement plans that meet the unique needs of each household, fostering stronger customer relationships and improving overall satisfaction. In this blog, we’ll explore how utilities can harness the power of AI to predict CSAT at this micro level and how BlastPoint’s mapping feature can visualize satisfaction scores at the household level and enhance this capability.
How BlastPoint’s AI-Driven Models Transform CSAT Prediction
BlastPoint’s AI-driven models revolutionize CSAT prediction by providing a deep, data-driven understanding of customer satisfaction. Our models integrate diverse data sources—including customer interactions, billing information, service usage patterns, and demographic details—to deliver real-time, granular insights at the household level. This comprehensive analysis helps utilities identify key satisfaction drivers and potential issues, allowing them to act proactively. To fully harness the power of these AI-driven insights, BlastPoint follows these essential steps to predict CSAT at the household level:
Steps to Predict CSAT at the Household Level
- Data Collection:
- Gather Diverse Data: Collect data from various sources such as customer interactions, billing information, and service usage patterns. This data forms the foundation for accurate predictions.

- Utilize AI-Driven Models:
- Machine Learning Analysis: Employ machine learning models to analyze the collected data. These models predict CSAT scores for each household on a daily basis, providing real-time insights.
- Granular Analysis:
- Detailed Insights: AI-driven models offer insights into key satisfaction drivers at a granular level, down to individual households. This enables targeted and effective strategies.
- Real-Time Updates:
- Daily Refreshes: CSAT scores are updated daily, allowing for timely interventions and adjustments to strategies as needed.
- Targeted Interventions:
- Customized Strategies: Use predicted CSAT scores to target specific households with tailored messages and solutions aimed at improving satisfaction.
Revolutionizing CSAT Prediction: Visualize and Enhance Household Satisfaction with SHAP Charts and Mapping
The Power of SHAP Charts in CSAT Prediction

SHAP (SHapley Additive exPlanations) Charts are a powerful tool in understanding and improving customer satisfaction. These charts help visualize how different factors impact CSAT scores:
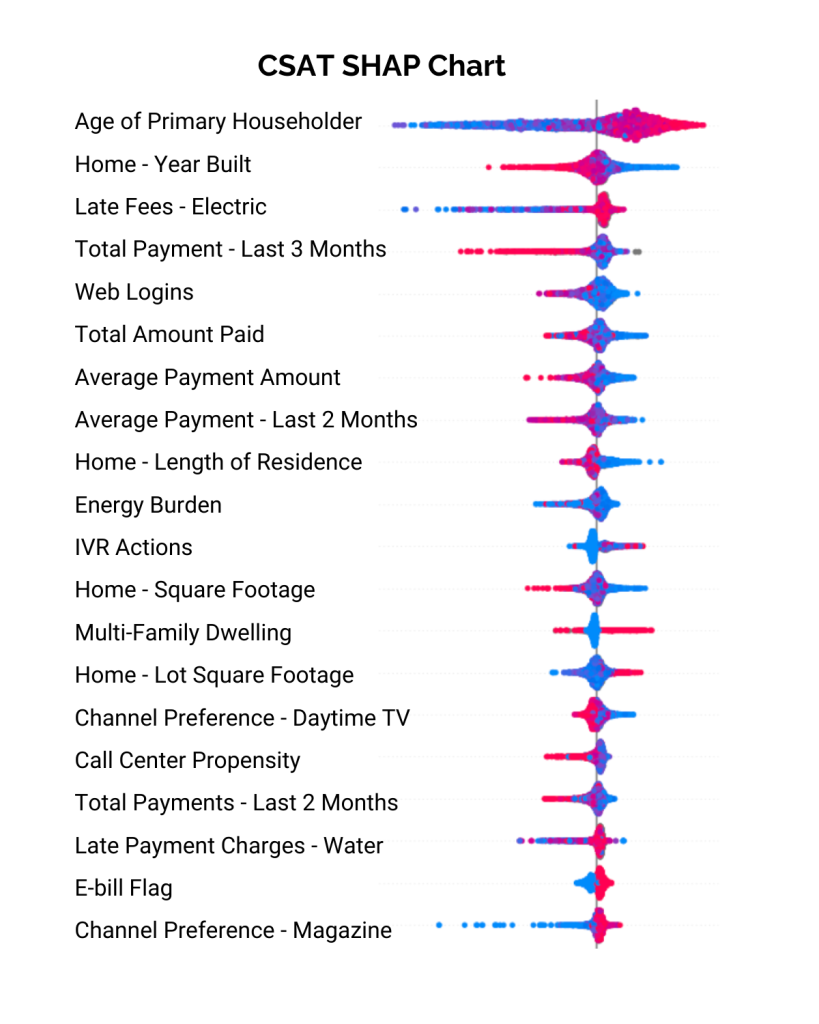
- Visual Clarity: SHAP charts display how various attributes, such as account balance or program engagement, affect CSAT. Bars extending to the left indicate negative impacts, while those extending to the right show positive impacts.
- Impact Measurement: The length of each bar in a SHAP chart represents the magnitude of its influence on CSAT. Longer bars indicate a more significant effect.
- Color Coding: Bars are color-coded for easy interpretation. Red shows high values for attributes, while blue represents low values.
For example, if a SHAP chart reveals that age has an impact on CSAT, utilities can focus on strategies that enhance satisfaction for older customers. By understanding these dynamics, utilities can make data-driven decisions to improve overall satisfaction.
Introducing the Mapping Feature
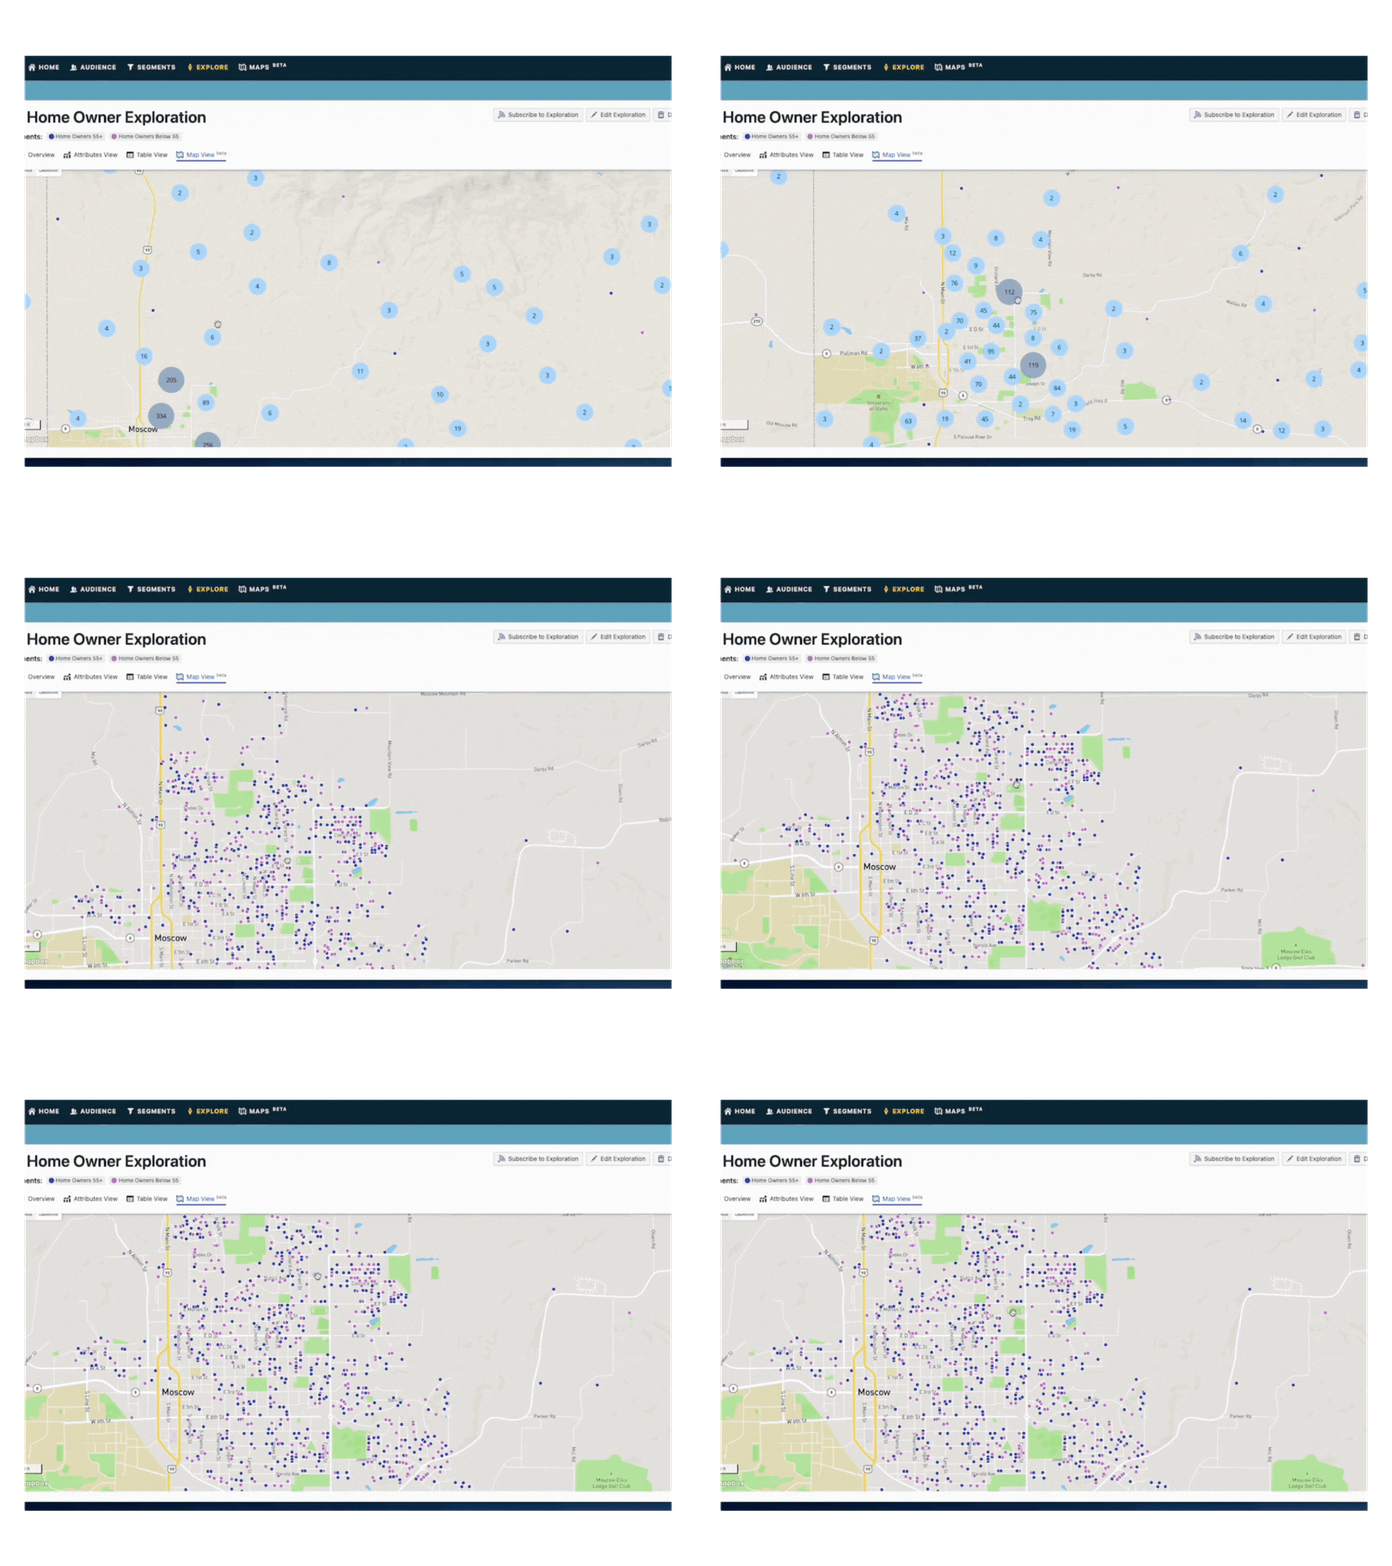
One of the most innovative ways to predict CSAT is through a mapping feature that allows utilities to visualize satisfaction scores at the household level. By mapping CSAT data, utilities can:
- Identify Patterns: Pinpoint areas with high or low CSAT scores and uncover geographic trends.
- Optimize Resource Allocation: Focus efforts and resources on specific regions that need the most attention.
- Enhance Targeted Campaigns: Customize outreach and interventions based on regional satisfaction trends.
This geographic mapping empowers utilities to tailor their strategies more precisely and address localized issues effectively.
Real-World Application: Case Study
Boost in Customer Engagement and Reduced Call Center Volume with Digital Solutions
American Electric Power (AEP), a major electric utility serving the Midwest and South through its seven subsidiaries, launched a new digital assistant on its website. Utilizing BlastPoint’s data-driven insights, AEP achieved clickthrough rates (CTR) 30% above customer services industry benchmarks within less than 2 months from launch!
Transforming Customer Satisfaction with Data-Driven Insights
Predicting and improving CSAT at the household level enables utilities to enhance customer experiences proactively. By leveraging AI models, SHAP charts, and geographic mapping, utilities can achieve a deeper understanding of their customers and implement more effective strategies.
Ready to revolutionize your customer satisfaction strategy? Contact us today to discover how BlastPoint’s AI-driven insights can elevate your utility’s CSAT management and drive meaningful improvements. Get in touch to learn more!
Schedule a demo